How to Calculate RCV with Qualtrics and RankedVote's CSV Import
What is Ranked Choice Voting?
Ranked choice voting is a voting system where voters can select their most preferred choices on a ballot – first, second, third, and so on – instead of just voting for a single choice. If no candidate receives enough first ranked votes to win a majority, the lowest vote-getter is eliminated. Anyone who voted for the eliminated candidate has their vote redistributed to their next ranked choice.
This elimination and redistribution process repeats until a choice receives enough votes to win.
Why use Ranked Choice Voting?
Any time you're making a decision with more than two choices and where voters have equal say, ranked choice voting is the right tool for the job. It uncovers preferences with greater accuracy and fidelity than traditional voting methods.
What is Qualtrics?
Qualtrics is a leading customer research and surveying platform used by everyone from the Fortune 500 to school districts across the world. It has a robust set of question types making it configurable for pretty much any use case you can imagine.
But, it does not support ranked choice voting directly. You'll need to use the RankedVote CSV Import Add-On to bridge that gap.
Read on to understand how to set up Qualtrics to simulate a ranked choice ballot, export your data, and calculate the results using RankedVote's CSV Import.
Steps to Calculate RCV using Qualtrics
Determine the decision that needs to be made
The first step is to get crisp on what decision needs to be made. Ranked choice voting works great in situations where you’re making a decision amongst a group of people with equal say. Groups like teams, organizations, and fan communities. This makes it differ from techniques like “weighted voting” or “100-point exercises.”
Fantastic uses for ranked choice voting include: selecting leadership, prioritizing work, running contests, and choosing award winners.
Once you know the decision that needs to be made, it’s time to start creating the survey.
Create the Ranked Choice Ballot Using "Matrix Table"
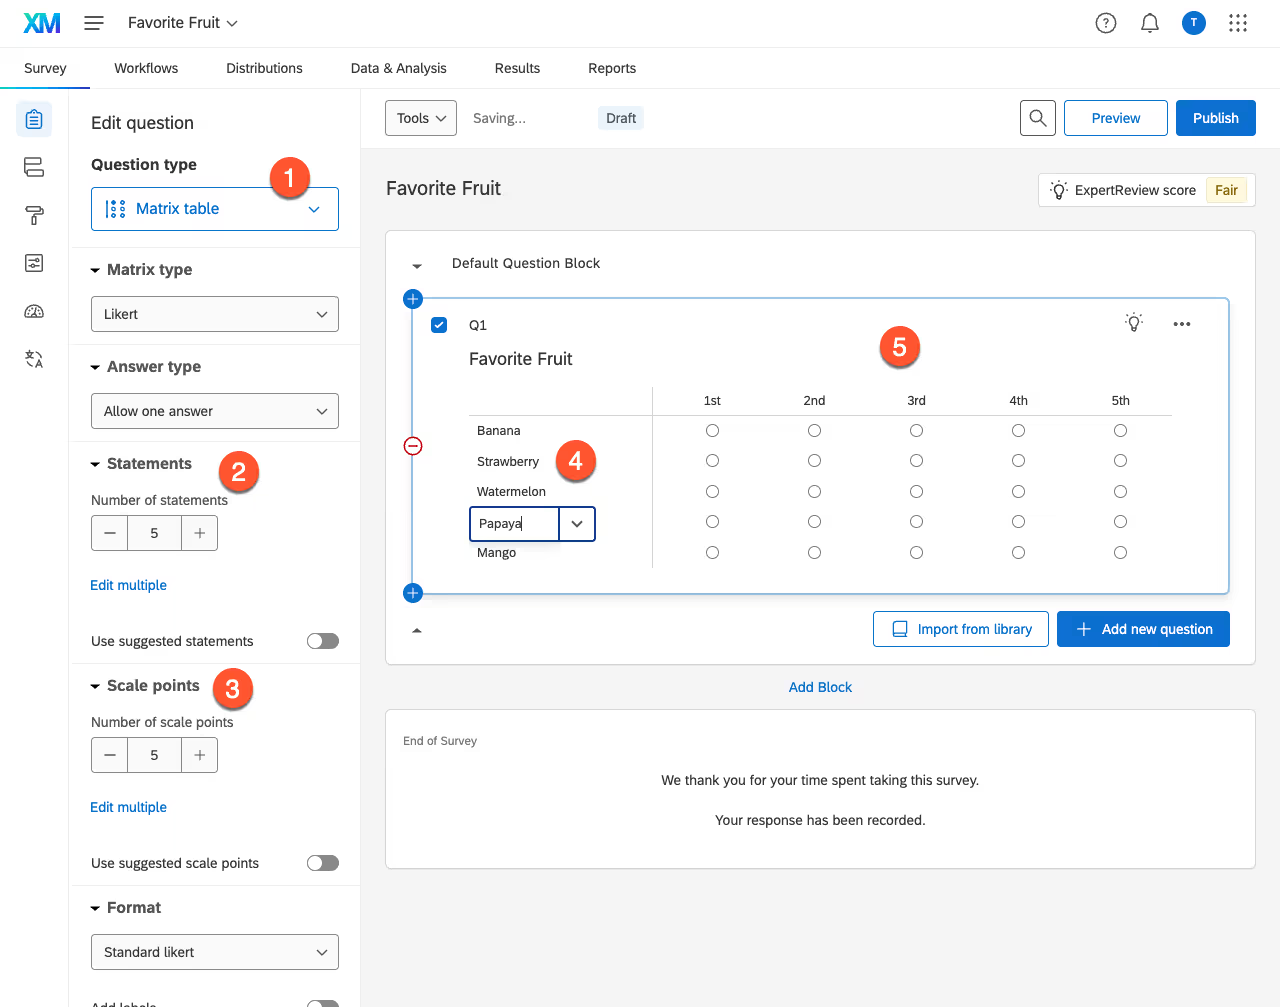
Over in Qualtrics, you can create a new project with a survey from scratch. Or, you can add a question to an existing survey with your decision that needs to be made. Here are the key fields to configure for ranked choice voting (numbered picture below):
- Question Type: Matrix Table (#1) — This will have your voters use a grid with rows and columns for their rankings. It's a decent approximation of what a ranked choice ballot looks like.
- Statements (#2) — These are the rows of your matrix table. Think of them as your "options" or "choices" or "candidates" ("Statements" is the Qualtrics terminology).
- Scale Points (#3) — These are the columns of your matrix table. They are the "rankings" voters will provide and should start with numbers (e.g. "1st, 2nd, 3rd, etc.") unless you have a really good reason not to. Starting with numbers allows for the data to be exported in a way that the RankedVote CSV Import expects.
- Rename Statements (#4) — In the question block, you can click in to each "statement" and type in whatever it is called (e.g. Banana, Strawberry, etc. in the image below).
- Rename Scale Points (#5) — Click in and type "1st," "2nd", "3rd", and so on.
Collect Responses
Now that you've created your ranked choice survey, you need people to vote! Click "Publish" and copy the link you're given. Email it, Slack it, text it...whatever is relevant for you to get it in front of your voters.
Any votes that are submitted are referred to as "responses" in Qualtrics.
Export Responses as CSV
Once all the votes are in, it’s time to go get that spreadsheet.
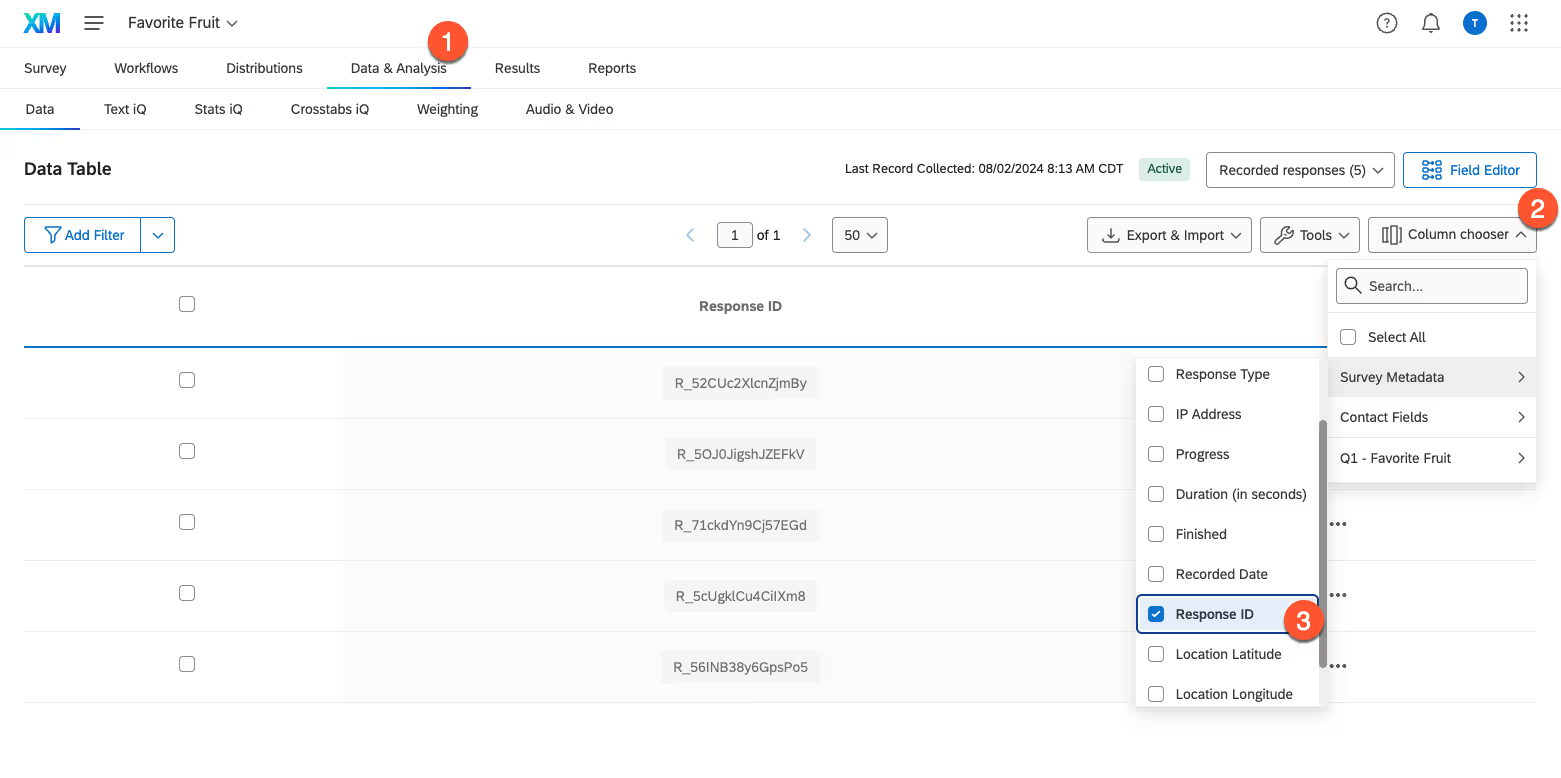
Go to "Data & Analysis" (#1 in the screenshot below) and you'll see a table view of all the responses that have come in so far. You'll need to do a little column wrangling to get the rankings to appear in the data.
The necessary data fields are a unique identifier for each response and the rankings for each choice.
The unique identifier in Qualtrics is called "Response ID." You can get that by going to the "Column Chooser" (#2), selecting "Survey Metadata," and then making sure "Response ID" is selected (#3).
To include the voter' rankings in the table, again go to the "Column Chooser," select the question that has your ranked choice ballot (#4 "Q1 - Favorite Fruit" in the image below), and then select "All Choices" (#5).
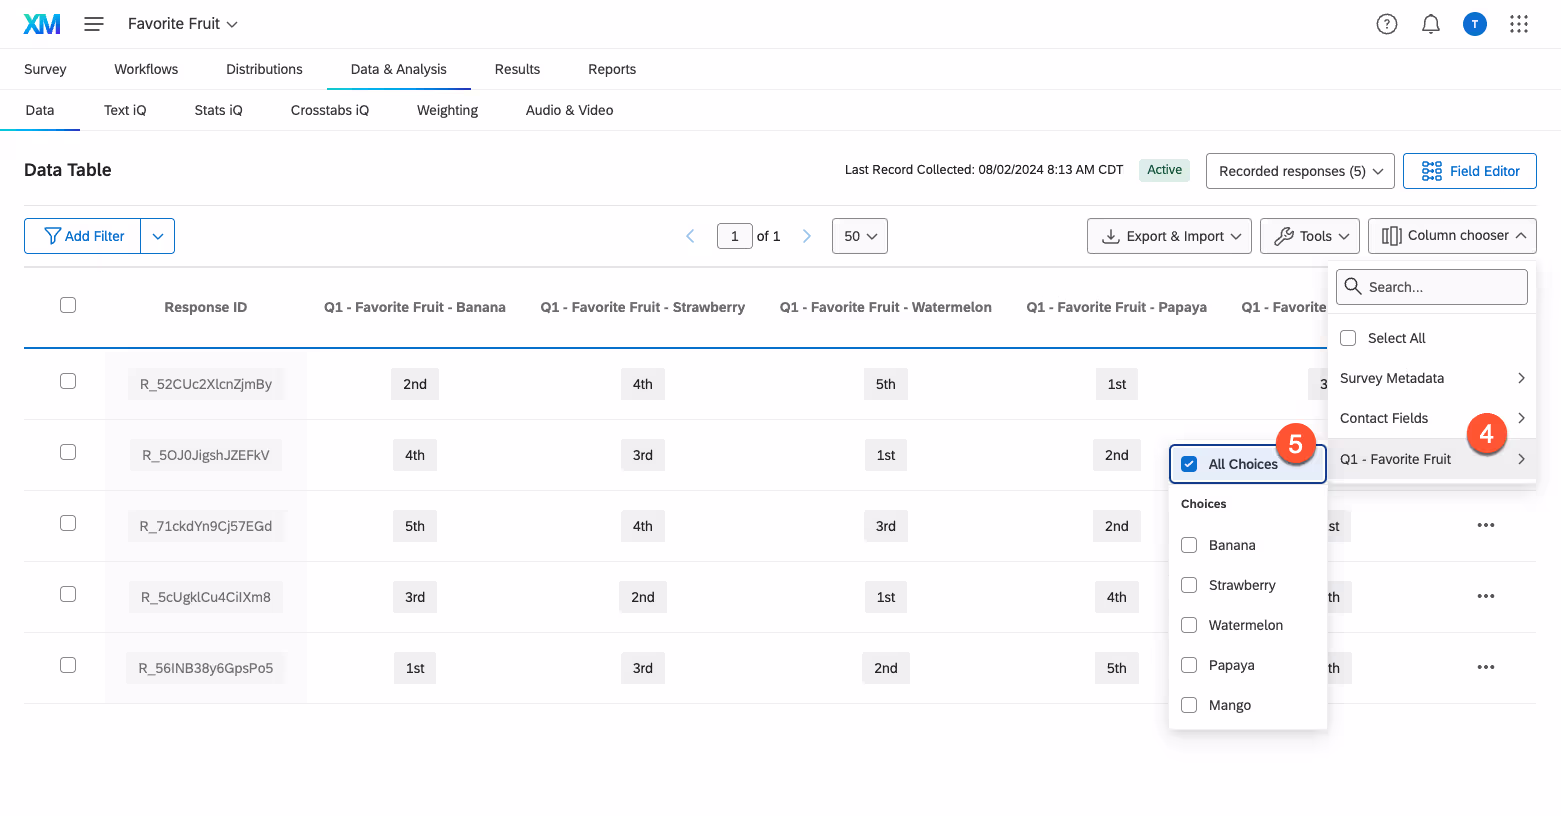
Next, click on "Export & Import" (#6) and then select "Export Data."
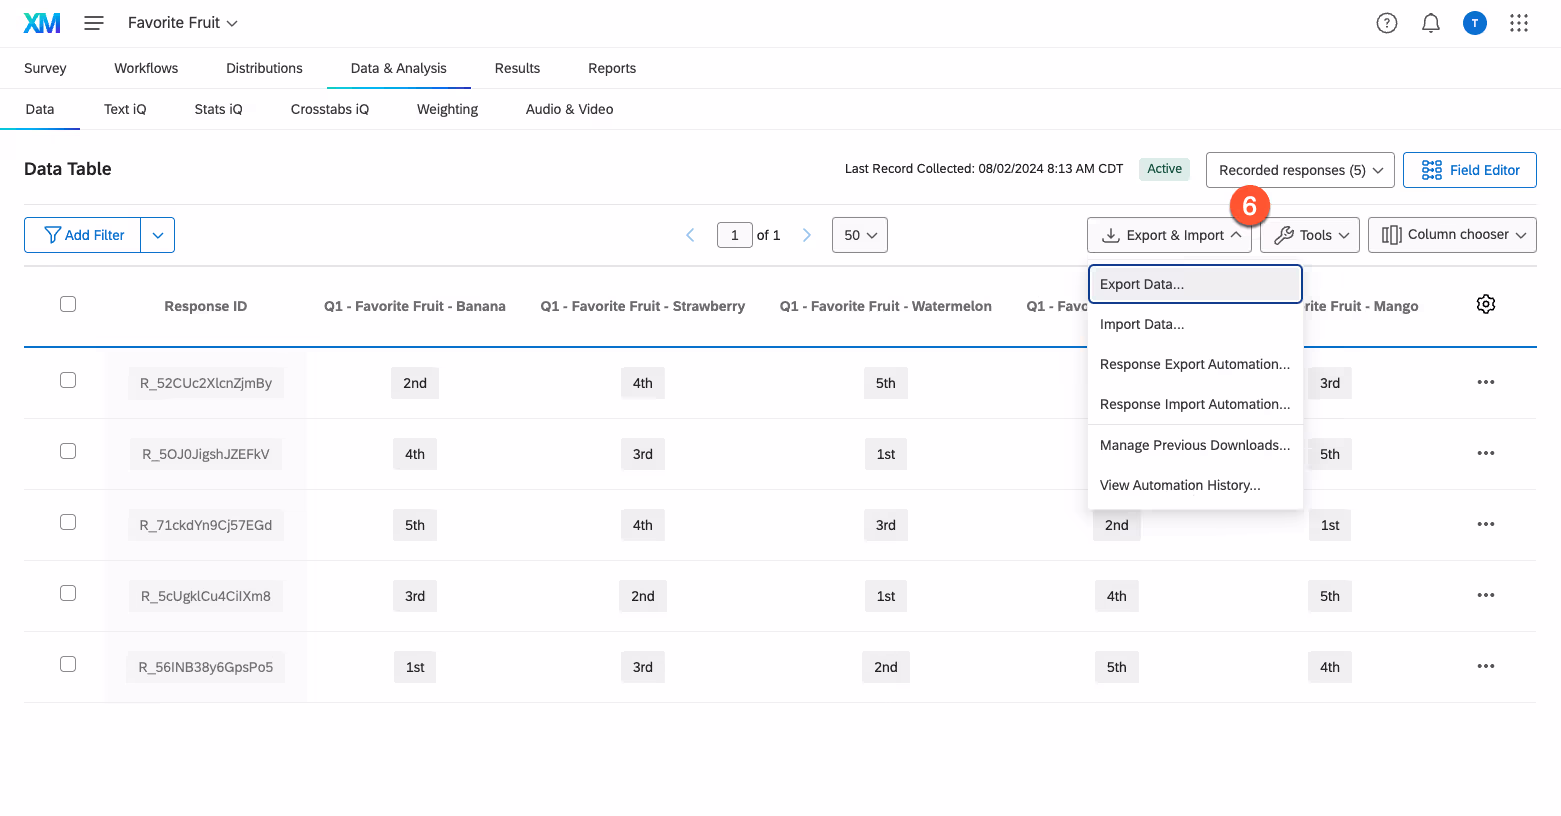
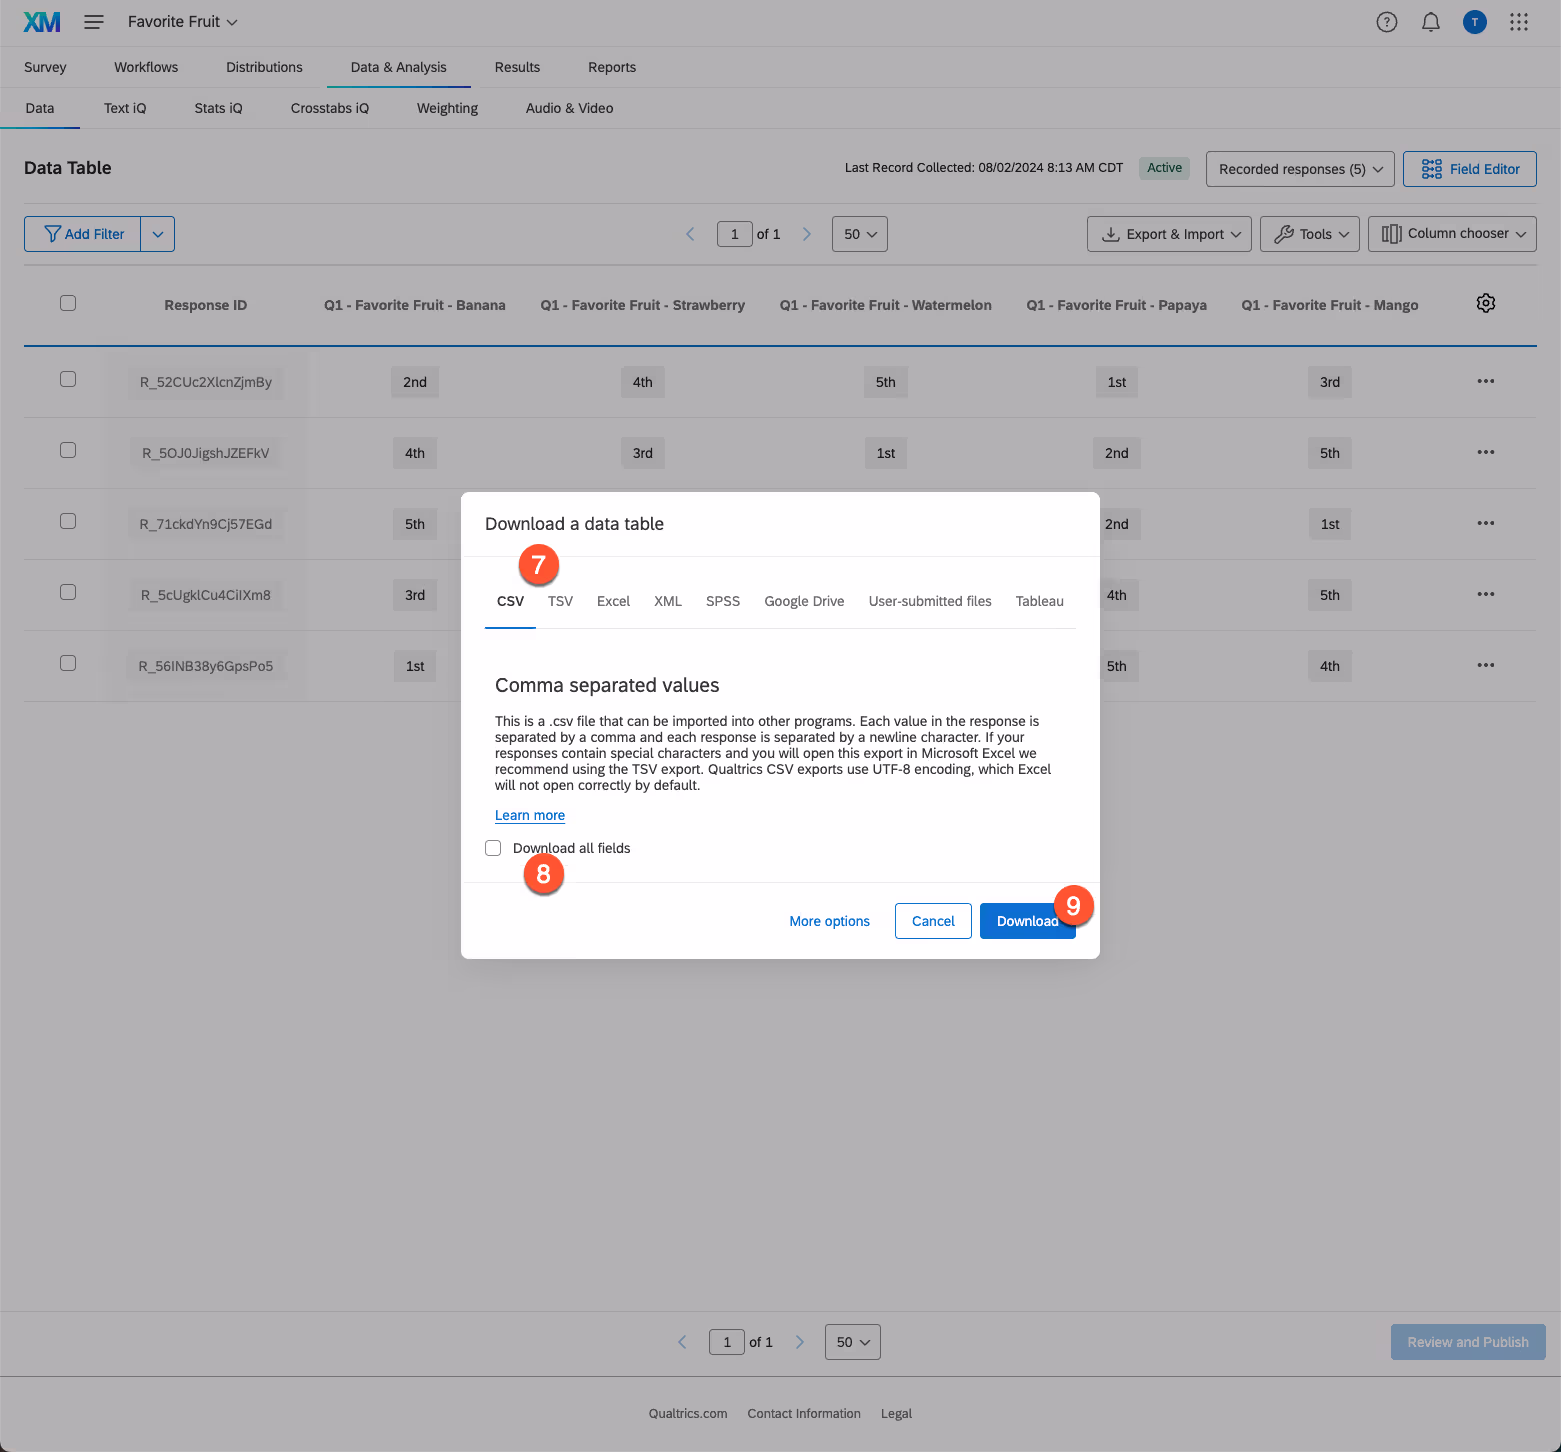
Then, in the popup that displays, make sure you're on the CSV tab (#7), that "Download all fields" is not checked (#8), and then click Download (#9). Wait a few moments and the CSV will be downloaded to your computer.
If "Download all fields" is checked, you'll end up with even more extraneous columns and rows in your spreadsheet that will need to be removed.
Check CSV Formatting
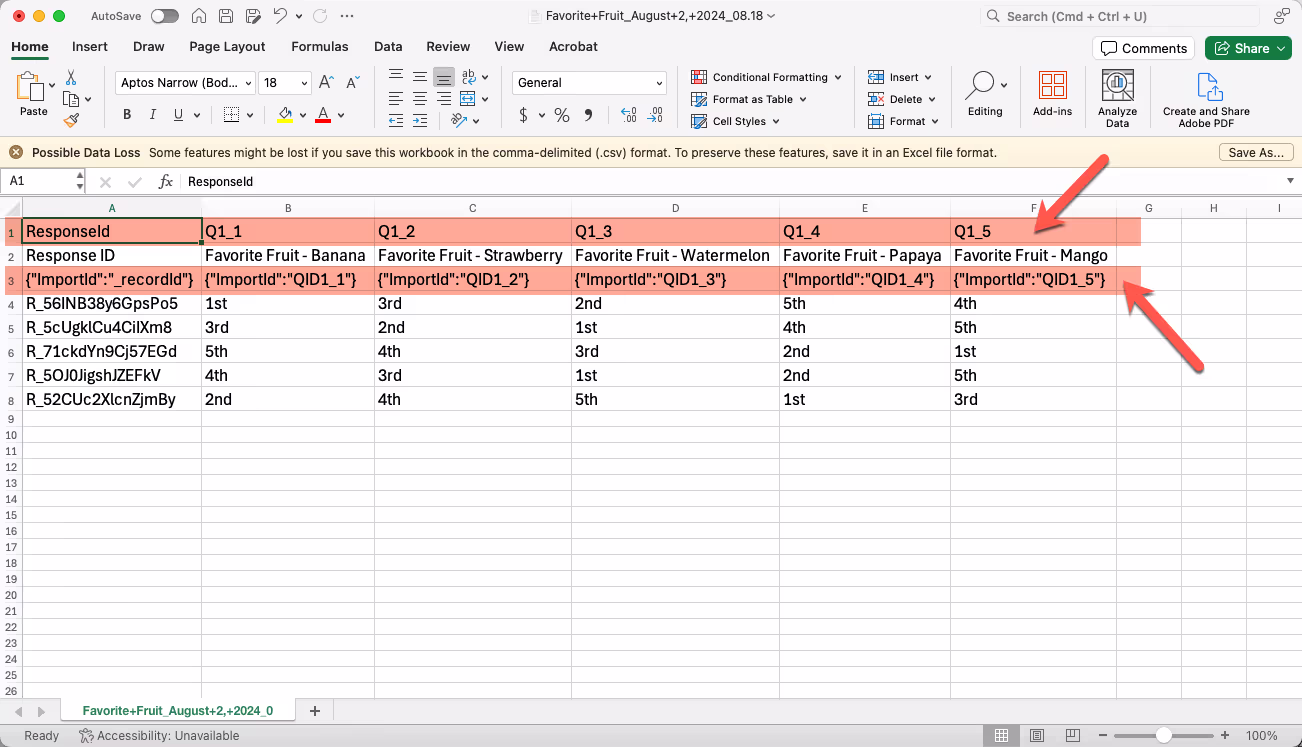
Open the CSV file that downloaded to your computer. You'll need to remove the following if they appear in your file:
- The row that has variable names for each question (e.g. Row 1 below with cells like "Q1_2")
- The row that items in curly brackets (e.g. Row 3 below with cells like {"ImportId":"QID1_2"})
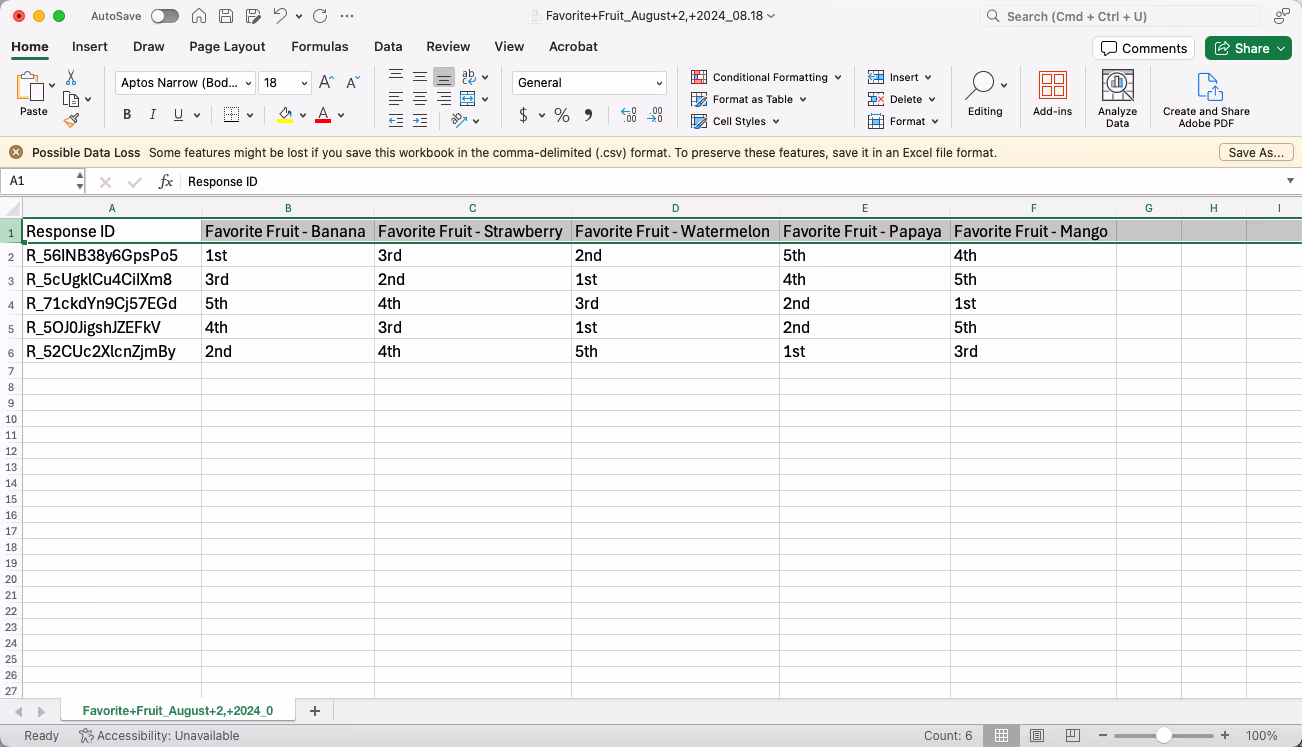
When you're done, it should look like this:
- The first column is a unique identifier for each voter ("Response" in Qualtrics's terms)
- The first cell in all columns after the first are the names of the choices that your voters voted upon
- The rankings under each column start with a number (i.e. "1st" or "1")
What if I have more columns?
If you ask multiple ranked choice questions or if you added additional fields (like asking for "First Name" and "Last Name") in your form, you'll need to do some column editing. The RankedVote CSV Import assumes it's dealing with one question at a time. The additional columns will muddy your results.
For each ranked choice question, save separate CSV files that contain your identifier (likely "Response ID") and just the columns representing the choices of that specific ranked choice question. Delete any excess columns.
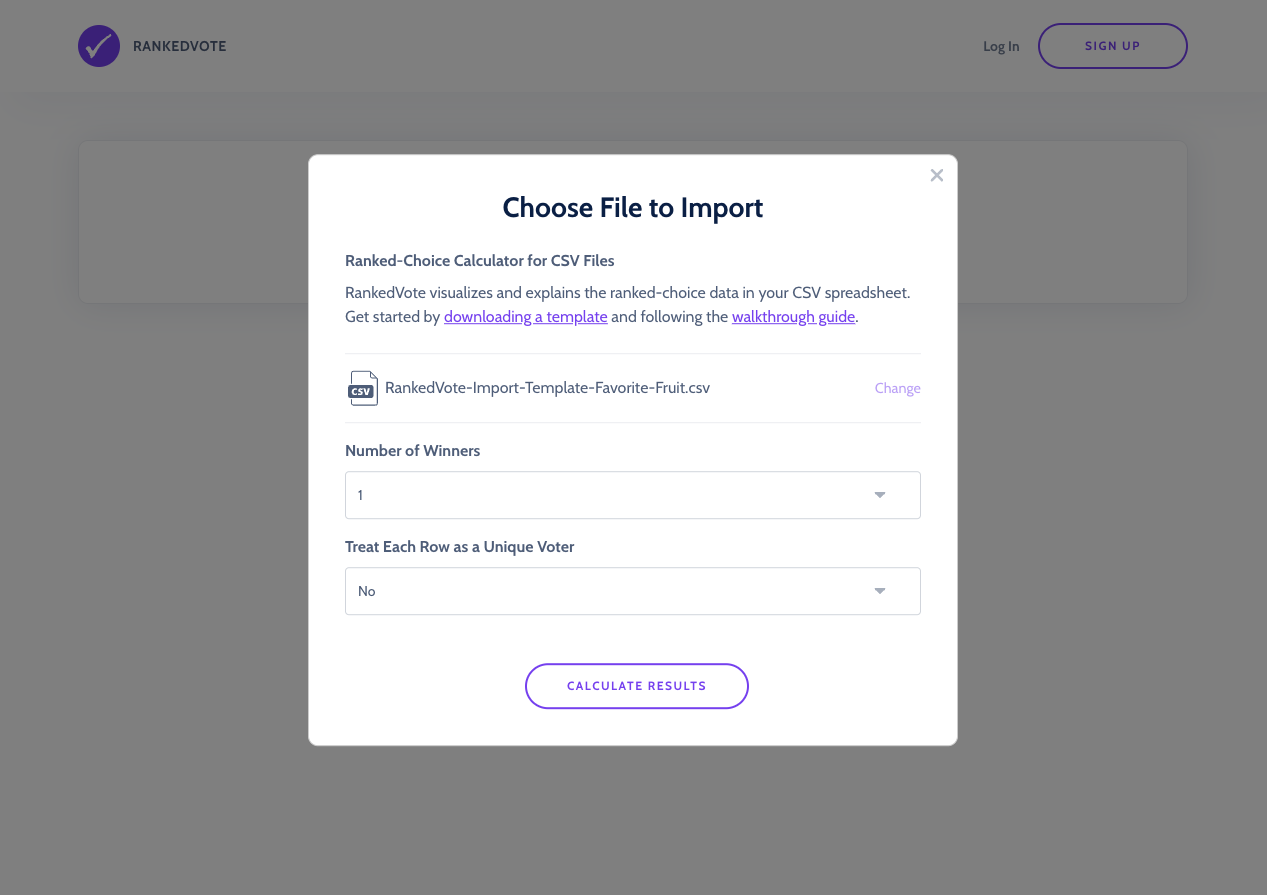
Use the RankedVote CSV Import Add-On
The votes are in, the CSV is exported, the columns are formatted...now it’s RCV calculation time! 🎉
Go to the RankedVote CSV Import Add-On, choose the CSV you just created, and click "Calculate Results."
Boom! You've now added this powerful decision-making technique to Qualtrics!
Don't forget to check out the in-depth guides for using the CSV Import Add-On and Understanding RCV Results to get the most out of all the features at your disposal.